
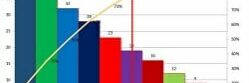
Pareto charts help people decide which problems to solve first. They are useful for identifying the most frequent outcome of a categorical variable. Learn how to transform data into actionable insight by creating a bar graph using the Pareto Principle 80/20 rule.
Learning Objectives:
- Through visual demonstration, Identify basic Pareto charts.
- Repeat 80/20 rule through presentation.
- List pros and cons through lecture and discussion.
Recording:
Presenter:
Jessica Bartolome | Executive Assistant & Fiscal Operations Manager
